Gumbel distribution
1 Distribution function
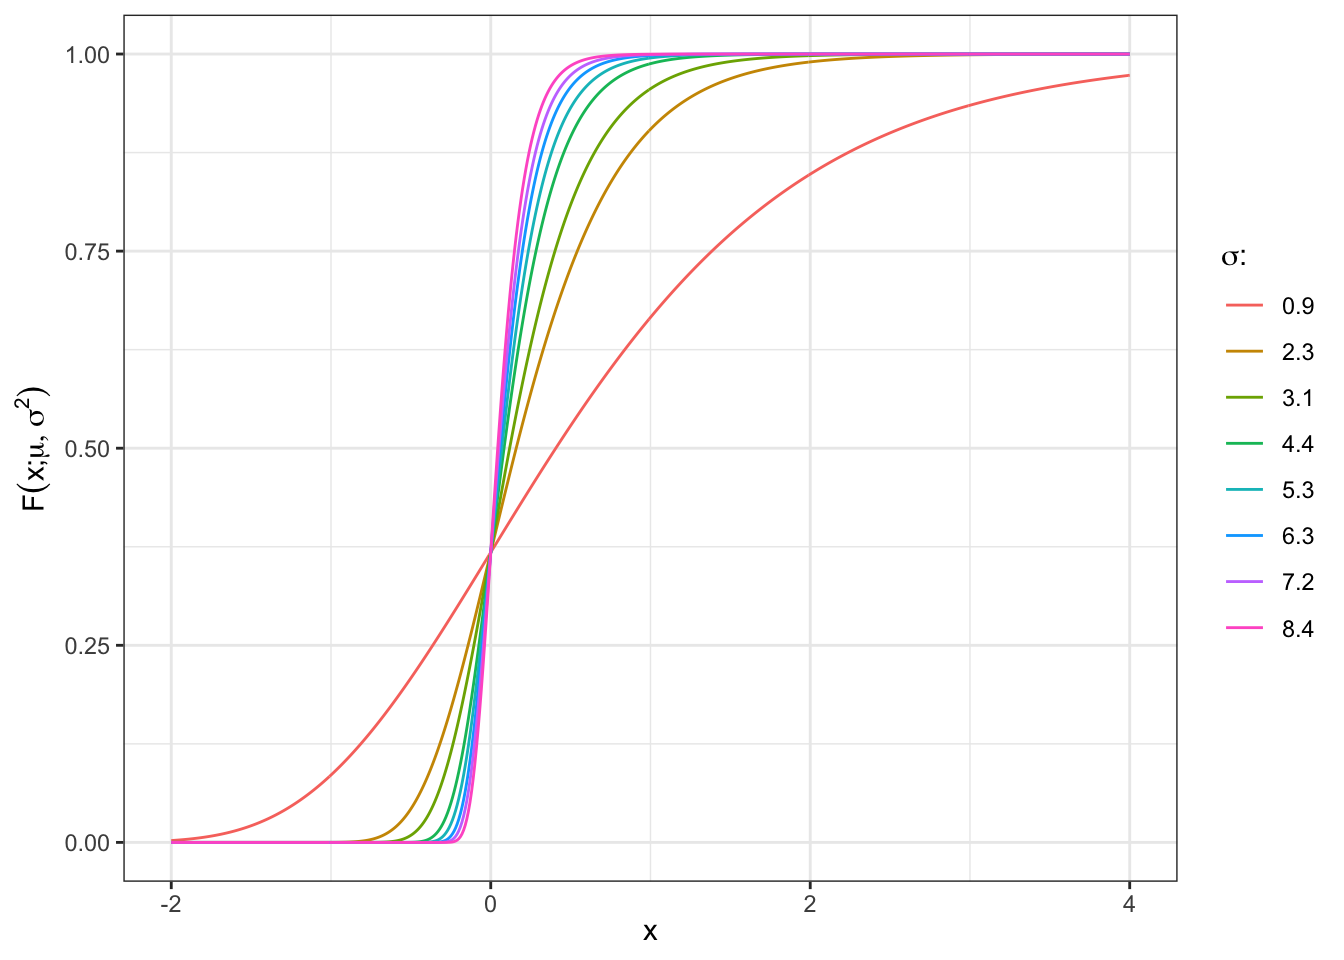
Defining \(z = \frac{x - \mu}{\sigma}\), the distribution function is given by: \[ F(x; \mu, \sigma) = \exp(-\exp(-z)) \tag{1}\]
In R code:
\[ \begin{aligned} \text{pgumbel}({} & x, \; \text{mean} = 1, \; \text{scale} = 1, \\ & \text{log.p} = {\color{red}{\text{FALSE}}}, \\ & \text{lower.tail} = {\color{green}{\text{TRUE}}}, \\ & \text{invert} = {\color{red}{\text{FALSE}}}) \end{aligned} \]
Distribution
grid <- seq(-2, 4, 0.01)
par <- list(a = c(0, 0.9), b = c(0, 2.3), c = c(0, 3.1), d = c(0, 4.4),
            e = c(0, 5.3), f = c(0, 6.3), g = c(0, 7.2), h = c(0, 8.4))
df_plot <- list()
for(i in 1:length(par)){
  df_plot[[i]] <- tibble(label = format(par[[i]][2], scientific=FALSE, digits = 3),
                         mean = par[[i]][1], scale = par[[i]][2],
                         x = grid, p = pgumbel(x, mean, scale))
}
bind_rows(df_plot) %>%
  ggplot()+
  geom_line(aes(x, p, color = label))+
  theme_bw()+
  labs(x = TeX("$x$"), y = TeX("$F(x;\\mu,\\sigma^2)$"), color = TeX("$\\sigma$: "))+
  theme(legend.position = "right")
2 Density function
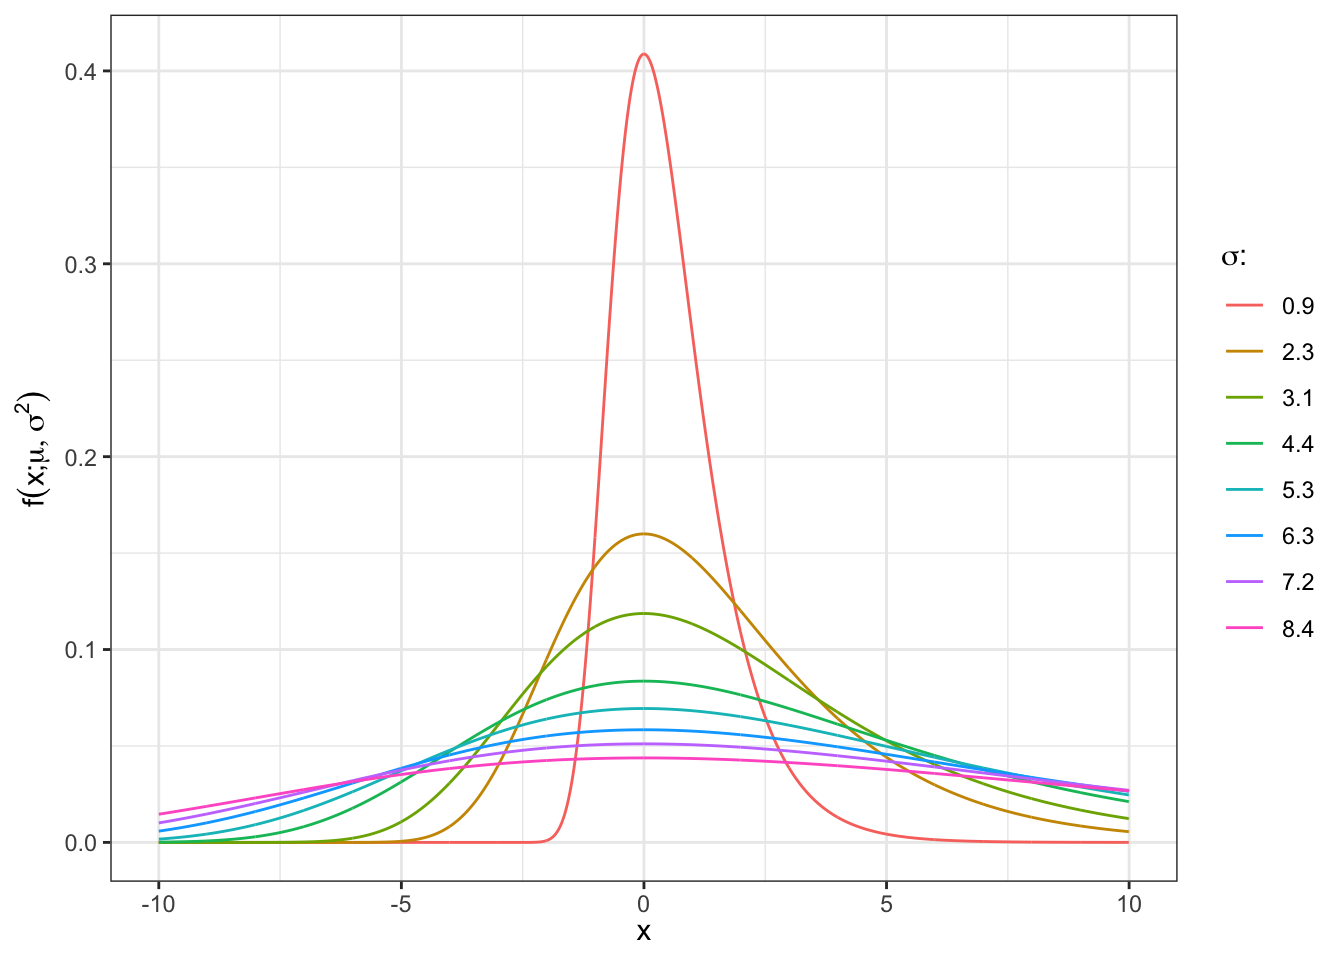
Defining \(z = \frac{x - \mu}{\sigma}\), the distribution function is given by: \[ f(x; \mu, \sigma) = \frac{1}{\sigma} e^{z + e^{-z}} \tag{2}\]
In R code:
\[ \begin{aligned} \text{dgumbel}({} & x, \; \text{mean} = 1, \; \text{scale} = 1, \\ & \text{log.p} = {\color{red}{\text{FALSE}}}) \end{aligned} \]
Density
grid <- seq(-10, 10, 0.01)
par <- list(a = c(0, 0.9), b = c(0, 2.3), c = c(0, 3.1), d = c(0, 4.4),
            e = c(0, 5.3), f = c(0, 6.3), g = c(0, 7.2), h = c(0, 8.4))
df_plot <- list()
for(i in 1:length(par)){
  df_plot[[i]] <- tibble(label = format(par[[i]][2], scientific=FALSE, digits = 3),
                         mean = par[[i]][1], scale = par[[i]][2],
                         x = grid, p = dgumbel(x, mean, scale))
}
bind_rows(df_plot) %>%
  ggplot()+
  geom_line(aes(x, p, color = label))+
  theme_bw()+
  labs(x = TeX("$x$"), y = TeX("$f(x;\\mu,\\sigma^2)$"), color = TeX("$\\sigma$: "))+
  theme(legend.position = "right")
3 Quantile function
\[ F^{-1}(p; \mu, \sigma) = \mu - \sigma \log(-\log(p)) \tag{3}\]
In R code:
\[ \begin{aligned} \text{qgumbel}({} & p, \; \text{mean} = 1, \; \text{scale} = 1, \\ & \text{log.p} = {\color{red}{\text{FALSE}}}, \\ & \text{lower.tail} = {\color{green}{\text{TRUE}}}, \\ & \text{invert} = {\color{red}{\text{FALSE}}}) \end{aligned} \]
4 Random generator
In general, given a random variable \(X \sim F_{X}\) following a certain distribution \(F_{X}\) and the correspondent quantile function \(F_{X}^{-1}\) (i.e. \(F_{X}^{-1}(F(X)) = X\)) it is possible to generate a random sample by simulating the grades. In steps:
Step 1.: simulate the grades \(u \sim \text{Unif}[0,1]\).
Step 2.: apply the quantile function of the desired distribution on the grades to obtain a simulations.
In R code:
\[ \begin{aligned} \text{rgumbel}({} & n, \; \text{mean} = 1, \; \text{scale} = 1, \\ & \text{invert} = {\color{red}{\text{FALSE}}}) \end{aligned} \]
Citation
@online{sartini2024,
  author = {Sartini, Beniamino},
  title = {Gumbel Distribution},
  date = {2024-05-01},
  url = {https://greenfin.it/statistics/distributions/gumbel.html},
  langid = {en}
}
